
Inspect a run
Inspection answers two separate questions: what the execution engine recorded, and what the dashboard’s metering view charged at run grain. Sapiom MCP returns the execution audit; the Agents dashboard combines that audit with the separate run-charge read.
Open the execution
Section titled “Open the execution”Ask Claude Code or Codex:
Inspect execution
<execution-id>and wait for it to finish or pause for an external signal. If the bounded wait expires, continue inspecting until one of those states is reached.
Sapiom MCP owns each bounded wait, which lasts up to 45 seconds by default. Advanced callers can change maxWaitSeconds, capped at 55 seconds. If the response says waiting: true because the window elapsed, your coding agent can inspect again. It should not add a shell sleep-and-poll loop.
The wait returns early with done: false when a paused run needs an external human or webhook signal. It keeps waiting through known dispatched-capability pauses because those callbacks resume automatically.
Open Agents, select the agent, choose Runs, and open the execution. The canonical URL has both identities:
https://app.sapiom.ai/agents/<definition-id>/runs/<execution-id>A legacy /agents/runs/<execution-id> link resolves the run and forwards to that nested route when the execution has an owning definition.
The MCP execution detail is cost-agnostic. It returns status, the pinned build ID, execution input and output/error, step attempts, redacted logs and capability events, shared-state snapshots, directives, and typed parent/child dispatch lineage. It does not silently fetch or fabricate spend.
Read the Run Inspector
Section titled “Read the Run Inspector”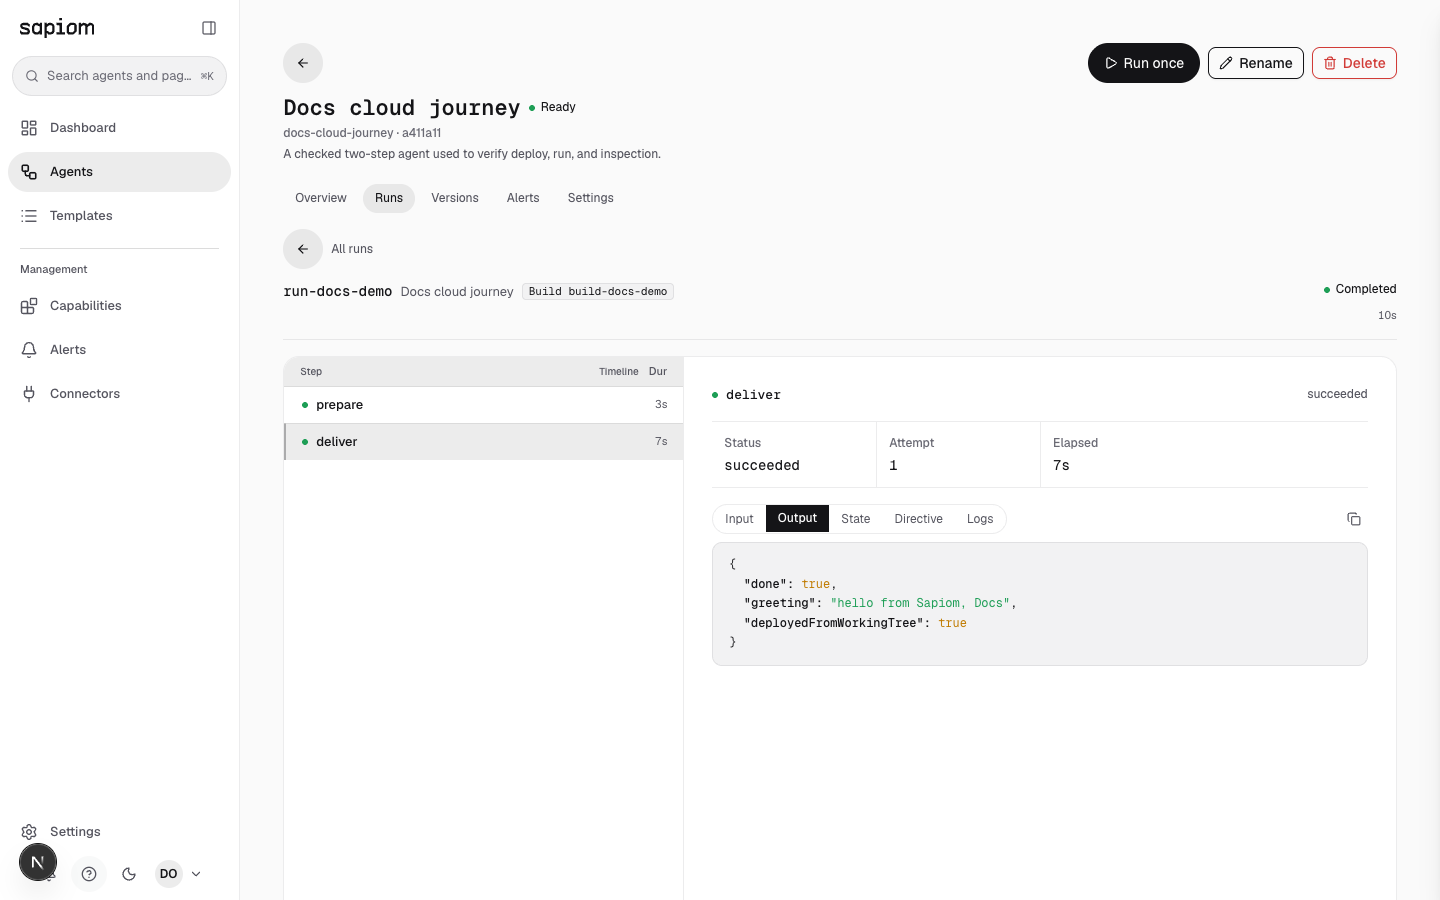
The maintained image uses sanitized fixture identity and the exact logical output from the clean-room production run. It contains no account, organization, credential, or private workspace data.
-
Confirm status and pinned build
Section titled “Confirm status and pinned build”The header shows the execution ID, agent name, Build <build-id>, terminal or live status, and elapsed time. Use the build ID—not the execution’s numeric CAS
version—when correlating a run to a deployment. -
Walk the step timeline
Section titled “Walk the step timeline”The left pane orders steps and collapses multiple attempts under the same step name. Select a row to see the current attempt’s status, attempt number, and elapsed time without moving the timeline.
-
Inspect recorded evidence
Section titled “Inspect recorded evidence”The evidence pane exposes Input, Output (or structured Error), State, and Directive for the selected attempt. Logs and Events appear only when the engine recorded them. Evidence is redacted and size-capped at the serve boundary; do not use the inspector as a secret store.
-
Follow child runs
Section titled “Follow child runs”When a step dispatched another agent, the typed dispatch ledger opens a child-run tree below the workspace. Child and parent links use recorded execution lineage, not guessed correlation-ID strings. A leaf run has no tree.
-
Read the run-grain charge
Section titled “Read the run-grain charge”The dashboard requests the run’s metered usage and settled overage separately. A non-zero or settling charge appears in the inspector header and footer. The current contract has no per-step, subtree, or cloud-build dollar attribution, so the UI does not assign a guessed cost to an individual step.
Know the agent routes
Section titled “Know the agent routes”| Route | Dashboard section | What it shows |
|---|---|---|
/agents/<definition-id> | Overview | Active graph, operational summaries, and setup state. |
/agents/<definition-id>/runs | Runs | Status/date-filtered, paged production executions. |
/agents/<definition-id>/runs/<run-id> | Run Inspector | Exact build, timeline, attempt evidence, lineage, and run-grain charge. |
/agents/<definition-id>/versions | Versions | Ready builds and recent synthesized commits, active state, rollback pin, and follow-latest. |
/agents/<definition-id>/alerts | Alerts | The agent’s alert policy and incidents. |
/agents/<definition-id>/secrets | Settings | Managed resources, write-only credential keys, and stored runtime settings for this one agent. |
A rollback pin changes which ready build future runs select. It does not rewrite the pinned build on an existing execution. Choosing Resume following latest clears the explicit pin.
Inspect a build instead
Section titled “Inspect a build instead”When deploy returns a build ID but the client wait times out, call sapiom_dev_agents_inspect with the linked project:
{ "dir": "/absolute/path/to/hello-agent", "buildRunId": "<build-id>"}Build inspection returns build status and its recorded error when present. It is distinct from an execution audit and does not create another build.
© 2026 Sapiom, Inc.